In my current job I have to able to provide on demand all kind of performance charts from the virtual machines through VMware vSphere Client.
While doing this some details caught my attention. I’ll try to explain.
Imagine that you want to take a performance log from one week ago lets say 26/08/2016 from 3:00PM till 5:00PM.
The normal procedure is:
- Find the machine
- Choose the Performance Tab and click in Advanced
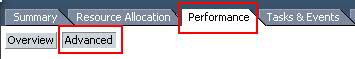
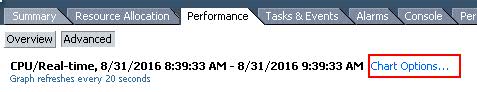
- Chart options
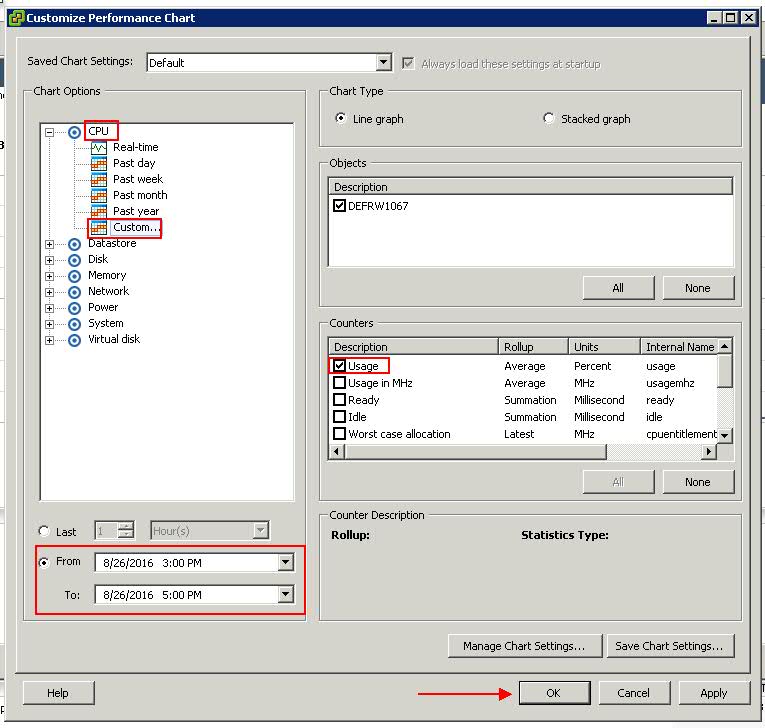
- Then you choose the Chart Option and in this case is going to be CPU then Custom with the time frame that we want, the counters Usage and click OK
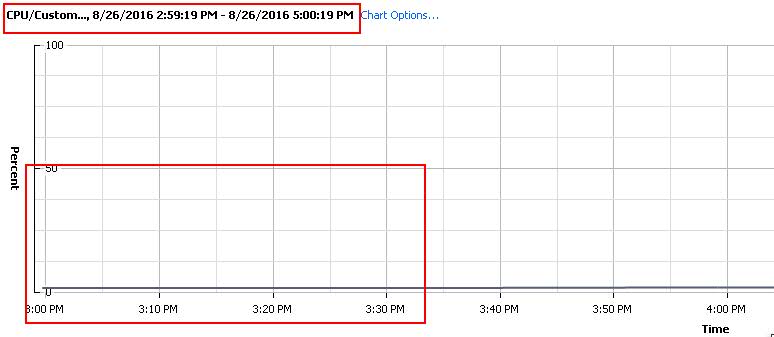
Now you have your graph all ready to present but… what is that? We are missing the first 30 minutes…
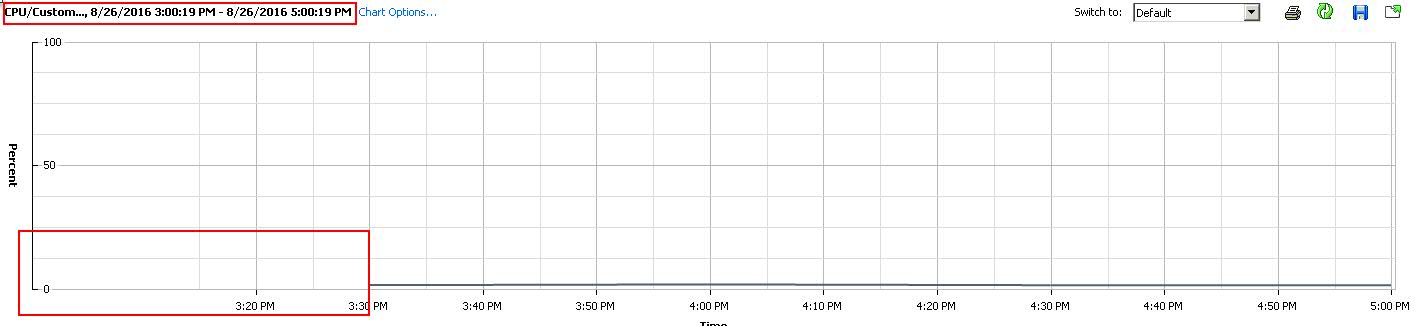
But the time frame is correct!!!
![]()
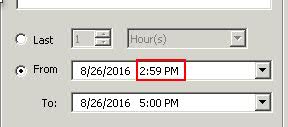
Well it’s not entirely correct as you can see it starts at 3:00:19 and VMware to save log space from performance logs older than a week only saves in 30 minutes intervals this means that you get a reference point from 30 minutes to 30 minutes and as the log starts at 3:00:19 you don’t get the first reference point.
The only way to solve this as we are unable to choose the seconds when we fill in the custom chart option is to put one minute earlier
Whit this tweak you’ll get your performance graph correct
I hope that VMware solves this “problem” and don’t assume the seconds in the performance charts or if so they must be zeroed.
Leave a Reply